Thursday, October 6, 2022

The Hatefulness of SELinux Compounded By IPA

A couple months ago, one of my customers' cyber-security teams handed down an edict that all IPA-managed users needed to have SELinux confinements applied. For admistrative accounts, this meant that administrators would SSH system and have an SELinux assignment of:

$ id -Z
staff_u:staff_r:staff_t:s0-s0:c0.c1023
And that when such administrative-users executed `sudo`, they would end up with an SELinux assignment of:
# id -Z
staff_u:sysadm_r:sysadm_t:s0-s0:c0.c1023

Not long after this, that same cyber-security team opened up a bug-ticket complaining that their scanners were no longer able to conduct all the tests they were able to conduct prior to the implementation of the confinement scheme (shocking, I know).

Since their scan-user operated with the same privilege set as human administrators did, their scan-user was getting similarly constrained. As an example of the practical impacts of this confinement, one need only try to look at the contents of the /etc/shadow file:

$ sudo cat /etc/shadow
/bin/cat: /etc/shadow: Permission denied

Since their security tooling was using that confined user-account to do – among a whole host of other check-tasks – functionally similar tests, naturally, some of their tests started failing and red lights started showing up on their dashboards. Worse (for them), their boss started asking why his summary-reports suddenly started to look like the elevator scene in The Shining after months of being mostly green.

Their problem ended up in my task-pile. I'm not really an SELinux guy …even if I can usually figure out how to get most third-party applications working that don't come with SELinux policy without having to resort to disabling SELinux. And, as much of "not really an SELinux guy" as I am, I'm really not an IPA guy. So, "fun times ahead".

Not wanting to waste time on the problem, and knowing that my customer had a Red Hat Enterprise Support entitlement, I opted to try to avail myself of that support. With my customer being part of a large, very-siloed organization, just getting a support case opened – and then actually able to directly read and comment on it rather than having to play "grape vine" – proved to be its own, multi-week ordeal.

After several days of back-and-forth, I was finally able to get the case escalated to people with SELinux and IPA expertise …but, seemingly, no one with both sets of expertise (yay). So, I was getting SELinux answers that included no "how do we actually do this wholly within IPA" and I was getting generic IPA guidance. The twain never quite met.

Ultimately, I was given guidance to do (after creating a scan-user POSIX-group to put the scan-user into):

  ipa selinuxusermap-add --hostcat='all' --selinuxuser=unconfined_u:s0-s0:c0.c1023 <SCAN_GROUP_NAME>
  ipa selinuxusermap-add-user <SCAN_GROUP_NAME> --group=<SCAN_GROUP_NAME>
  ipa sudorule-add <SCAN_USER_SUDO_RULE_NAME> --hostcat='all' --cmdcat='all'
ipa sudorule-add-option <SCAN_GROUP_RULE_NAME> --sudooption '!authenticate' ipa sudorule-add-option <SCAN_GROUP_RULE_NAME> --sudooption role=unconfined_r ipa sudorule-add-option <SCAN_GROUP_RULE_NAME> --sudooption type=unconfined_t ipa sudorule-add-user <SCAN_GROUP_RULE_NAME> --group=<SCAN_GROUP_NAME> sudo bash -c "service sssd stop ; rm -f /var/lib/sss/db/* ; service sssd start"

Unfortunately, this didn't solve my problem. My scan-user continued to be given the same SELinux profile upon logging in and executing `sudo` that my "normal" administrative users were. Support came back and told me to re-execute the above, but to give the sudorule a precedence-setting:

  ipa selinuxusermap-add --hostcat='all' --selinuxuser=unconfined_u:s0-s0:c0.c1023 <SCAN_GROUP_NAME>
  ipa selinuxusermap-add-user <SCAN_GROUP_NAME> --group=<SCAN_GROUP_NAME>
  ipa sudorule-add <SCAN_USER_SUDO_RULE_NAME> --hostcat='all' --cmdcat='all' --order=99
  ipa sudorule-add-option <SCAN_GROUP_RULE_NAME> --sudooption '!authenticate'
  ipa sudorule-add-option <SCAN_GROUP_RULE_NAME> --sudooption role=unconfined_r
  ipa sudorule-add-option <SCAN_GROUP_RULE_NAME> --sudooption type=unconfined_t
  ipa sudorule-add-user <SCAN_GROUP_RULE_NAME> --group=<SCAN_GROUP_NAME>
  sudo bash -c "service sssd stop ; rm -f /var/lib/sss/db/* ; service sssd start"

Still, even having set a precedence on the `sudo` rule, my scan-user wasn't getting the right confinement rules applied. The support rep had me execute `ipa user-show <SCAN_USER> --all`. Upon doing that, we noticed that the <SCAN_USER> account was affiliated with two `sudo` rules. Then using `ipa sudorule-show <SUDO_RULE_NAME> --all` for each rule, was able to find that one of the two rules was applying the `!authenticate`, `role=sysadm_r` and `type=sysadm_t` sudo-options.

I made the assumption that, even though we'd explicitly set a precedence-value on the one rule, the previously-existing rule likely didn't have a precedence-value set and that, as a result, implicit-precedence rules were still being applied ...and that the previously-existing rule "won" in that scenario. To test, I did:

ipa sudorule-mod <EXISTING_RULE> --order=10

And then retested with my scan-user. At this point, the scan-user was functioning as desired. This meant that:

  1. My supposition about implicit and explicit rule-ordering was correct
  2. That the rules are processed on a "higher-number == higher-priority" precedence-processing
Unfortunately, due to limitations in RHEL7 and the version of IPA in use by my customer (vendor-rep checked internal documentation for this determination), I had to leave the scan-user wholly unconstrained. Customer's security-team is likely to gripe about that, but I figure that, since they own the offending user, they can deal with the consequences (paperwork) associated with adequately-relaxing security for that user so that their scans would return to a functional state.

Monday, October 3, 2022

You CAN Make the Logs' Format Worse?!

Most of my customers have security compliance mandates that makes it necessary to offload their Linux auditd event-logs to an external/centralized logging-destination. One of my customers leverages a third-party tool to offload their EC2 logs directly to S3. However, because they use a common compliance-framework to guide their EC2s' hardening configurations, they had been configuring their systems to use the "normal" auditd dispatch plugin service, audisp. Unfortunately, prior my arrival, no one had actually bothered to validate their auditing configuration. Turns out, audisp was trying to off-host the event logs to a non-existent, centralized event-collector that didn't actually exist.

My "solution" to their problem was to simply eliminate the CM-automation that sets up the errant event-offloading. However, before I could suggest summarily nuking this automation-content, I had to verify that their S3-based logging solution was actually working. So, decided to cobble together a quick-n-dirty AWS CLI command – because their log-stream names are the same as the associated EC2s' instance-IDs, doing the quick test was easy:

$ aws logs filter-log-events\
  --log-group-name  \
  --log-stream-names $(
    curl -s http://169.254.169.254/latest/meta-data/instance-id
  )   --start-time $(
    date -d '-15 minutes' '+%s%N' | \
    cut -b 1-13
  )
To explain the above - particularly the nested subshells…

Executing:
curl -s http://169.254.169.254/latest/meta-data/instance-id
Makes use of the EC2 metadata service to return the EC2s own AWS instance-ID. Because it's being executed in a subshell – using the $( COMMAND ) notation – The instance's ID is returned as the value fed to the `--log-stream-names` command-option.

Similarly, executing:

date -d '-15 minutes' '+%s%N' | cut -b 1-13
Makes use of the `date` command to return an `aws logs` compatible time specification for use by the --start-time command-option. Specifically, it tells the date command, "take the time 15 minutes ago and convert it to milliseconds since epoch-time. Because the time-shifted, date-string is longer than what the  `aws logs` command-option expects, we use the `cut` command to truncate it to a compatible length. Ultimately, this will return output similar to:

{
  "logStreamName": "i-0a8b14c42b651476f",
  "timestamp": 1664815386793,
  "message": "{\"a0\":\"b75480\",\"a1\":\"0\",\"a2\":\"0\",\"a3\":\"7ffeb692d220\",\"arch\":\"c000003e\",\"auid\":\"239203505\",\"az\":\"us-gov-west-1a\",\"comm\":\"vim\",\"ec2_instance_id\":\"i-0a8b14c42b651476f\",\"egid\":\"239203505\",\"euid\":\"239203505\",\"exe\":\"/usr/bin/vim\",\"exit\":\"0\",\"fsgid\":\"239203505\",\"fsuid\":\"239203505\",\"gid\":\"239203505\",\"items\":\"2\",\"key\":\"delete\",\"log_file\":\"/var/log/audit/audit.log\",\"node\":\"ip-10-244-0-100.dev.ac2sp.army.mil\",\"pid\":\"10503\",\"ppid\":\"3961\",\"ses\":\"3\",\"sgid\":\"239203505\",\"subj\":\"staff_u:staff_r:staff_t:s0-s0:c0.c1023\",\"success\":\"yes\",\"suid\":\"239203505\",\"syscall\":\"84\",\"tty\":\"pts1\",\"type\":\"SYSCALL\",\"uid\":\"239203505\"}",
  "ingestionTime": 1664815388879,
  "eventId": "37126623743463896942643741908611915331411397433463734292"
}
Kind of horrible. But, you can extract the actual message payload with a tool like `jq` which will give you output like:

{
    "a0": "b75480",
    "a1": "0",
    "a2": "0",
    "a3": "7ffeb692d220",
    "arch": "c000003e",
    "auid": "239203505",
    "az": "us-gov-west-1a",
    "comm": "vim",
    "ec2_instance_id": "i-0a8b14c42b651476f",
    "egid": "239203505",
    "euid": "239203505",
    "exe": "/usr/bin/vim",
    "exit": "0",
    "fsgid": "239203505",
    "fsuid": "239203505",
    "gid": "239203505",
    "items": "2",
    "key": "delete",
    "log_file": "/var/log/audit/audit.log",
    "node": "ip-10-244-0-100.dev.ac2sp.army.mil",
    "pid": "10503",
    "ppid": "3961",
    "ses": "3",
    "sgid": "239203505",
    "subj": "staff_u:staff_r:staff_t:s0-s0:c0.c1023",
    "success": "yes",
    "suid": "239203505",
    "syscall": "84",
    "tty": "pts1",
    "type": "SYSCALL",
    "uid": "239203505"
}
Yeah… If you're familiar with audit.log output, that ain't normally what it looks like. Here, the OS's event-data has been intermingled with the CSP's event log-tracking data. Not great. Not something you can feed "as-is" to generic tools that expect to directly interact with auditd data (e.g., the tools in the policyutils RPMs). But, you can write filters to get it back into a tool-compatible format. But still, it manages to make an ugly log format markedly-uglier to deal with. So, uh, congratulations?

Friday, September 23, 2022

Code Explainer: Regex and Backrefs in Ansible Code

Recently, I'd submitted a code-update to a customer-project I was working on. I tend to write very dense code, even when using simplification frameworks like Ansible. As a result, I had to answer some questions asked by the person who did the code review. Ultimately, I figured it was worth writing up an explainer of what I'd asked them to review…

The Ansible-based code in question was actually just one play:

---
- name: Remove sha512 from the LOG option-list
  ansible.builtin.lineinfile:
    backrefs: true
    line: '\g<log>\g<equals>\g<starttoks>\g<endtoks>'
    path: /etc/aide.conf
    regexp: '^#?(?P<log>LOG)(?P<equals>(\s?)(=)(\s?))(?P<starttoks>.*\w)(?P<rmtok>\+?sha512)(?P<endtoks>\+?.*)'
    state:present
...

The above is meant to ensure that the contents of the RHEL 7 config file, "/etc/aide.conf" sets the propper options on for the defined scan-definition, "LOG". The original contents of the line were:

LOG = p+u+g+n+acl+selinux+ftype+sha512+xattrsfor

The STIGs were updated to indicate that the contents of that line should actually be:

LOG = p+u+g+n+acl+selinux+ftype+xattrsfor

The values of the Ansible play's regexp and backrefs attributes are designed to use the advanced line-editing afforded through the Ansible lineinfile module's capability. Ansible is a Python-based service. This module's advanced line-editing capabilities are implemented using Python's re() function. The regexp attribute's value is written to make use of the re() function's ability to do referenceable search-groupings. Search-groupings are specified using parenthesis-delimited search-rules (i.e., "(SEARCH_SYNTAX)").

By default, a given search-grouping is referenced by a left-to-right index-number. These number starting at "1". The reference-IDs can then be referenced – also refered to as "backrefs" – in the replacement-string (through the value of the play's line attribute) to help construct the replacement string's value. Using the index-number method, the replacement-string would be "\1\2\6\8" …which isn't exactly self-explanatory.

To help with readability, each group can be explicitly-named. To assign a name to a search-group, one uses the syntax ?P<LABEL_NAME> at the beginning of the search-group. Once the group is assigned a name, it can subsequently be referenced by that name using the syntax "\g<LABEL_NAME>".

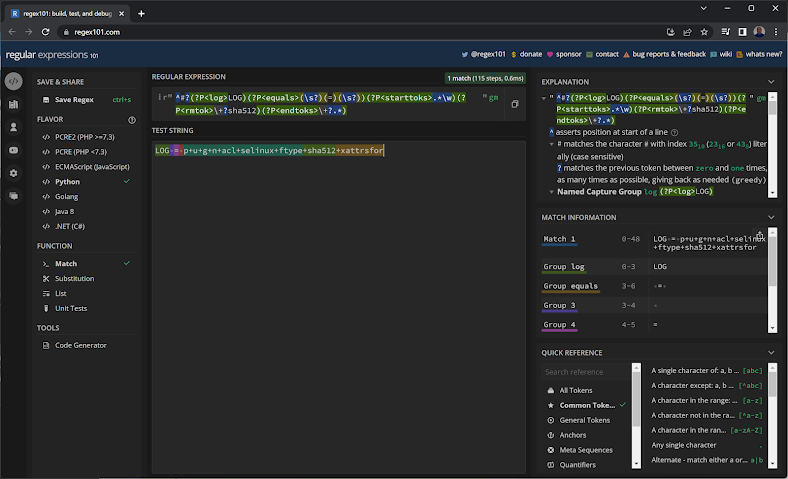
If one visits the Regex101 web-site and selects the "Python" regex-type from the left menu, one can get a visual representation of how the above regexp gets interpreted. Enter the string to be evaluated in the "TEST STRING" section and then enter the value of the regexp parameter in the REGULAR EXPRESSION box. The site will then show you how the regex chops up the test string and tell you why it chopped it up that way:

Regex101 Screen-cap


Tuesday, September 20, 2022

Crib Notes: Quick Audit of EC2 Instance-Types

Was recently working on a project for a customer who was having performance issues. Noticed the customer was using t2.* for the problematic system. Also knew that I'd seen them using pre-Nitro instance-types on some other systems they'd previously complained about performance problems with. Wanted to put a quick list of "you might want to consider updating these guys" EC2s. Ended up executing:


$ aws ec2 describe-instances \
   --query 'Reservations[].Instances[].{Name:Tags[?Key == `Name`].Value,InstanceType:InstanceType}' \
   --output text | \
sed -e 'N;s/\nNAME//;P;D'

Because the describe-instances's command-output is multi-line – even with the applied --query filter – adding the sed filter was necessary to provide a nice, table-like output:

t3.medium       ingress.dev-lab.local
t2.medium       etcd1.dev-lab.local
m5.xlarge       k8snode.dev-lab.local
m6i.large       runner.dev-lab.local
t2.small        dns1.dev-lab.local
t3.medium       k8smaster.dev-lab.local
t2.medium       bastion.dev-lab.local
t3.medium       ingress.dev-lab.local
t2.medium       etcd0.dev-lab.local
m5.xlarge       k8snode.dev-lab.local
m6i.large       runner.dev-lab.local
m5.xlarge       k8snode.dev-lab.local
t2.xlarge       workstation.dev-lab.local
t2.medium       proxy.dev-lab.local
t2.small        dns0.dev-lab.local
t3.medium       ingress.dev-lab.local
t2.medium       etcd2.dev-lab.local
m5.xlarge       k8snode.dev-lab.local
t2.medium       mail.dev-lab.local
m6i.large       runner.dev-lab.local
t2.small        dns2.dev-lab.local
t3.medium       k8smaster.dev-lab.local
t2.medium       bastion.dev-lab.local
t2.medium       proxy.dev-lab.local

Tuesday, August 23, 2022

Dense Coding and Code Explainers

My role with my employer is frequently best described as "smoke jumper". That is, a given project they're either priming or, more frequently, subbing on is struggling and the end customer has requested further assistance getting things more on the track they were originally expecting to be on. How I'm usually first brought onto such projects is automation-support "surge".

In this context, "surge" means resources brought in to either fill gaps in the existing project-team created by turnover or augmenting that team with additional expertise. Most frequently, that's helping them either update and improve existing automation or write new automation. Either way, the code I tend to deliver tends to be both fairly compact and dense as well as flexible compared to what they've typically delivered to date.

One of my first-principles in delivering new functionality is to attempt to do so in a way that is easily deactivated or backed out. This project team, like others I've helped, uses Terraform, but in a not especially modular or function-isolating way. All of the deployments consist of main.tfvars.tf and outputs.tf files and occational "template" files (usually simple HERE documents with simple variable-substitution actions). While they do (fortunately) make use of some data providers, they're not real disciplined about where they implement them. They embed them in either or both of a given service's the main.tf and vars.tf files. Me? I generally like all of my data-providers in data.tf type of files as it aids consistency and keeps the type of contents in the various, individual files "clean" from an offered-functionality standpoint.

Similarly, if I'm using templated content, I prefer to deliver it in ways that sufficiently externalizes the content to allow appropriate linters to be run on it. This kind of externalization not only allows such files to be more easily linted but, because it tends to remove encapsulation effects, it tends to make either debugging or extending the externalized content easier to do.

On a recent project, I was tasked with helping them automate the deployment of VPC endpoints into their AWS accounts. The customer was trying, to the greatest extent possible, prevent as much of their project-traffic from leaving their VPCs as possible.

When I started the coding-task, the customer wasn't able to tell me which specific services they wanted or needed so-enabled. Knowing that each such service-endpoint comes with recurring costs and not wanting them to accidentally break the bank, I opted to write my code in a way that, absent operator input, would deploy all AWS endpoint services into their VPCs but also easily allow them to easily dial things back when the first (shocking) bills came due.

The code I delivered worked well. However, as familiar with the framework as the incumbent team was, they were left a bit perplexed by the code I delivered. They asked me to do a walkthrough of the code for them. Knowing the history of the project – both from a paucity-of-documentation and staff-churn perspective – I opted to write an explainer document. What follows is that explanation.

Firstly, I delivered my contents as four, additional files rather than injecting my code into their existing  main.tfvars.tf and outputs.tf file-set. Doing so allowed them to wholly disable functionality simply by nuking the files I delivered rather than having to do file-surgery on their normal file-set. As my customer is operating in multiple AWS partitions, this makes dealing with partitions' API differences easier to roll back changes if the deployment-partition's APIs are older then their development-partition's are. The file-set I delivered was an endpoints_main.tf, endpoints_data.tf,  endpoints_vars.tf and an endpoints_services.tpl.hcl file. Respectively these files encapsulate: primary functionality; data-provider definitions; definition of variables used in the "main" and "data" files; and an HCL-formatted default-endpoints template-file.

The most basic/easily-explained file is the default-endpoints template file, endpoints_services.tpl.hcl. The file consists of map-objects encapsulated in a larger list structure. The map-objects consist of name and type attribute-pairs. The name values were derived by executing:

aws ec2 describe-vpc-endpoint-services \
  --query 'ServiceDetails[].{Name:ServiceName,Type:ServiceType[].ServiceType}' | \
sed -e '/\[$/{N;s/\[\n *"/"/;}' -e '/^[        ][      ]*]$/d' | \
tr '[:upper:]' '[:lower:]'

And then changing the literal region-names to "${endpoint-region}". This change allows Terraform's templatefile() function to sub in the desired-value when the template file is read – making the automation portable across both regions and partitions. The template-file's contents are also encapsulate with Terraform's jsondecode() function. This encapsulation is necesary to allow the templatefile() function to properly read the file in (so that the variable-substitution can occur).

Because I wanted the use of this template-file to be the fallback (default) behavior, I needed to declare its use as a fallback. This was done in the endpoint_data.tf file's locals {} section:

locals {
  vpc_endpoint_services = length(var.vpc_endpoint_services) == 0 ? jsondecode(
    templatefile(
      "./endpoint_services.tpl.hcl",
      {
        endpoint_region = var.region
      }
    )
  ) 
}  

In the above, we're using a ternary evaluation to set the value of the locally-scoped vpc_endpoint_services variable. If the size of the globally-scoped vpc_endpoint_services variable is "0", then the template file is used; otherwise, the content of the globally-scoped vpc_endpoint_services variable is used. The template-file's use is effected by using the templatefile() function to read the file in while substituting all occurrences of "${endpoint-region}" in the file with the value of the globally-scoped "region" variable.

Note: The surrounding jsondecode() function is used to convert the file-stream from the format previously set using the jsonencode() function at the beginning of the file. I'm not a fan of having to resort to this kind of kludgery, but, without it, the templatefile() function would error out when trying to populate the vpc_endpoint_services variable. If any reader has a better idea of how to attain the functionality desired in a less-kludgey way, please comment.

Where my customer needed the most explanation was the logic in the section:

data "aws_vpc_endpoint_service" "this" {
  for_each = {
    for service in local.vpc_endpoint_services :
    "${service.name}:${service.type}" => service
  }

  service_name = length(
    regexall(
      var.region,
      each.value.name
    )
  ) == 1 ? each.value.name : "com.amazonaws.${var.region}.${each.value.name}"
  service_type = title(each.value.type)
}

This section leverages Terraform's aws_vpc_endpoint_service data-source. My code gives it the reference id "this". Not a terribly original or otherwise noteworthy label, but, absent the need for multiple such references, it will do.

The for_each function iterates over the values stored in the locally-scoped vpc_endpoint_services object-variable. As it loops, assigns each dictionary-object – the name and type attribute-pairs – to the service loop-variable. In turn, the loop iteratively-exports an each.value.name and each.value.type variable.

I could have set the service_name variable to more-simply equal the each.value.name variable's value, however, I wanted to make life a bit less onerous for the automation-user. Instead of needing to specify the full service-name path-string, the short-name could be specified. Using the regexall() function to see if the value of the region globally-scoped variable was present in the each.value.name variable's value allows the length() function to be used as part of a ternary definition for the service_name variable. If returned length is "0", the operator-passed service-name is prepended with the fully-qualified service-path typically valid for the partition's region; if the returned length is "1", then the value already stored in the each.value.name variable is used. 

Similarly, I didn't want the operator to need to care about the case of the service-type they were specifying. As such, I let Terraform's title(function) take care of setting the proper case of the each.value.type variable's value.

The service_type and service_name values are then returned when the data-provider is called from the endpoint_main.tf file's locals {} block is processed:

locals {
  […elided…]
  # Split Endpoints by their type
  gateway_endpoints = toset(
    [
      for e in data.aws_vpc_endpoint_service.this :
      e.service_name if e.service_type == "Gateway"
    ]
  )
  interface_endpoints = toset(
    [
      for e in data.aws_vpc_endpoint_service.this :
      e.service_name if e.service_type == "Interface"
    ]
  )
  […elided…]
}

The gateway_endpoints and interface_endpoints locally-scoped variables are each list-variables. Each is populated by taking the service-name returned from the data.aws_vpc_endpoint_service.this data-provider if the selected-for service_type value matches. This list-vars are then iteratively-processed in the relevant resource "aws_vpc_endpoint" "interface_services" and resource "aws_vpc_endpoint" "gateway_services" stanzas.

Friday, June 3, 2022

Hop, Skip and a Jump

A few weeks ago, I got assigned to a new project. Like a lot of my work, it's fully remote. Unlike most of my prior such gigs, while the customer does implement network-isolation for their cloud-hosted resources, they aren't leveraging any kind of trusted developer desktop solution (cloud-hosted or otherwise). Instead, they have per-environment bastion-clusters and leverage IP white-listing to allow remote access to those bastions. To make that white-listing more-manageable, they require each of their vendors to coalesce all of the vendor-employees behind a single origin-IP.

Working for a small company, the way we ended up implementing things was to put a Linux-based EC2 (our "jump-box") behind an EIP. The customer adds that IP to their bastions' whitelist-set. That EC2 is also configured with a default-deny security-group with each of the team members' home IP addresses whitelisted.

Not wanting to incur pointless EC2 charges, the EC2 is in a single-node AutoScaling Group (ASG) with scheduled scaling actions. At the beginning of each business day, the scheduled scaling-action takes the instance-count from 0 to 1. Similarly, at the end of each business day, the scheduled scaling-action takes the instance-count from 1 to 0. 

This deployment-management choice also has the benefit of not only reducing compute-costs but ensures that there's not a host available to attack outside of business hours (in case the the default-deny + whitelisted source IPs isn't enough protection). Since the auto-scaled instance's launch-automation includes an "apply all available patches" action, it means that day's EC2 is fully updated with respect to security and other patches. Further, it means that on the off chance that someone had broken into a given instantiation, any beachhead they establish goes "poof!" when the end-of-day scale-to-zero action occurs.

Obviously, it's not an absolutely 100% bulletproof safety-setup, but it does raise the bar fairly high for would-be attackers

At any rate, beyond our "jump box" are the customer's bastion nodes and their trusted IPs list. From the customer-bastions, we can then access the hosts that they have configured for development activities to be run from. While they don't rebuild their bastions or the "developer host" instances as frequently as we do our "jump box", we have been trying to nudge them in a similar direction.

For further fun, the customer-systems require using a 2FA token to access. Fortunately, they use PIN-protected PIVs rather than RSA fobs. 

Overall, to get to the point where I'm able to either SSH into the customer's "developer host" instances or use VSCode's git-over-ssh capabilities, I have to go:

  1. Laptop
  2. (Employer's) Jump Box
  3. (Customer's) Bastion
  4. (Customer's) Development host
Wanting to keep my customer-work as close to completely separate from the rest of my laptop's main environment, I use Hyper•V to run a purpose-specific RHEL8 VM. For next-level fun/isolation/etc., my VM's vDisk is LUKS-encrypted. I configure my VM to provide token-passthrough, to make it easy to do my PIV-authenticated access to the customer-system(s). But, still, there's a whole lot of hop-skip-jump just to be able to start running my code-editor and pushing commits to their git-based SCM host.

During screen-sharing sessions, I've observed both my company's other consultants and the customer's other vendor's consultants executing these long-assed SSH commands. Basically, they do something like:
$ ssh -N -L <LOCAL_PORT>:<REMOTE_HOST>:<REMOTE_PORT> <USER>@<REMOTE_HOST> -i ~/.ssh/key.pub
…and they do it for each of hosts 2-4 (or just 3 & 4 for the consultants that are VPNing to a trusted network). Further, to keep each hop's connection open, they fire up `top` (or similar) after each hop's connection is established.

I'm a lazy typist. So, just one of those ssh invocations makes my soul hurt. In general, I'm a big fan of the capabilities afforded by using a suitably-authored ${HOME}/.ssh/config file. Prior to this engagement, I mostly used mine to set up host-aliases and ensure that things like SSH key and X11 forwarding are enabled. However, I figured there was a way to further configure things to result in a lot fewer key-strokes and typing. So, started digging around.

Ultimately, I found that OpenSSH's client-configuration offers a beautiful option for making my life require far fewer keystrokes and eliminate the need for starting up "keep the session alive" processes. That option is the "ProxyJump" directive (combined with suitable "LocalForward" and, while we're at it, "User" directives). In short, what I did was I set up one stanza to define my connection to my "jump box". Then added a stanza that defines my connection to the customer's bastion, using the "ProxyJump" directive to tell it "use the jump box to reach the bastion host". Finally, I added a stanza that defines my connection to the customer's development host,  using the "ProxyJump" directive to tell it "use the bastion host to reach the development host". Since I've also added requisite key- and X11-forwarding directives as well as remote service-tunneling directives, all I have to do is type:
$ ssh <CUSTOMER>-dev
And, after the few seconds it takes the SSH client to negotiate three, linked SSH connections, I'm given a prompt on the development host. No need to type "ssh …" multiple times and no need to start `top` on each hop. 

Side note: since each of the hops also implement login banners, adding:
LogLevel error
To each stanza saves a crapton of banner-text flying by and polluting your screen (and preserving scrollback buffer!).

As a bit of a closing note: if any of the intermediary nodes are likely to change with any frequency and change in a way that causes a given remote's HostKey to change, adding:
UserKnownHostsFile /dev/null
To your config will save you from polluting your ${HOME}/.ssh/known_hosts file with no-longer-userful entries for a given SSH host-alias. Similarly, if you want to suppress the "unknown key" prompts, you can add:
StrictHostKeyChecking false
To a given host's configuration-stanza. Warning: the accorded convenience does come with the potential cost of exposing you to undetected man-in-the-middle attacks.

Friday, May 20, 2022

Preparing to Clean a Repository

 Most of the customer-projects I work on use a modular repository system. That is to see, each discrete service-element is developed in a purpose-specific repository. Further, most of the customer-projects I work on use a fork-and-branch workflow. As such, the "upstream" repositories tend to stay fairly "clean" of stale branch content.

Recently, I was moved to a project where the customer uses a (ginormous) mono-repo design for their repository and uses a simple, wholly branch-based workflow. As team members are assigned Jira tickets, they open a branch (almost always) off the project-trunk. Once they complete the modifications within their branch, the submit a merge-request back and, if accepted, their branch gets deleted …assuming the submitter has ticked the "Delete source branch when merge request is accepted" checkbox in their MR.

Unfortunately, not every branch actually ends up getting merged and, even more-frequently, not every MR submitter ticks the delete-on-accept checkbox in their MR. So, as the project goes on, there gets to be more and more stale branches hanging around.

I'm a bit of a neat-freak when it comes to what I like to see in the output of any given tool I use. It's why a prefer when tools offer good output-filtering …and get cranky when, as part of "improving" an interface, output-filtering is adversely impacted (I'm glaring at you, Amazon, and your "improvements" to the various service-components' web-consoles).

As a result of this, when I join a new project and see a "cluttered" project-root, I like to see, "can this mess be cleaned up". A quick way to do that is check how old the various branches are as, typically, if a branch has been sitting out there with no activity on it for two or more months, it's probably stale. One way to check for such staleness is a quick shell one-liner:

     (
        for branch in $(
          git branch -r | grep -v HEAD
        )
        do
           echo -e $(
             git show --format="%ci|%cr|%cN|" $branch | head -n 1
           ) $branch
        done | sort
     ) | \
     sed -e 's/|\s+/|/g' | 
     awk -F '|' '{ printf ("%s\t%-20s\t%-20s\t%s\n",$1,$2,$3,$4) }'
Whata the above does is iterates across all branches, finding the most-recent commit in the branch, then formats each line of the output into a |-delimited string. Since the commit-date (in ISO 8601 format) is the first column of each line, the sort causes all of the output-lines to be displayed in ascending recency-order. The `sed` line is a bit of a shim – ensuring that extraneous white-spaces afer the |-delimiter are removed. The `awk` statement just ensures that the output has a nice, aligned columnar display. For example:
2021-02-16 20:21:23 +0000       1 year, 3 months ago    Billy Madison          origin/PROJ-9388
2021-04-14 13:09:26 -0400       1 year, 1 month ago     Art Donovan            origin/PROJ-11000
2021-06-04 12:57:35 +0000       12 months ago           Billy Madison          origin/PROJ-8538
2021-06-16 11:37:18 -0400       11 months ago           William Gibson         origin/PROJ-11649
2021-06-16 15:43:15 -0400       11 months ago           William Gibson         origin/PROJ-11364
2021-07-16 17:39:23 -0400       10 months ago           William Gibson         origin/PROJ-11767
2021-09-02 16:54:02 -0400       9 months ago            Art Donovan            origin/PROJ-13029
2021-09-22 14:07:16 +0000       8 months ago            David Graham           origin/PROJ-13023
2021-10-04 16:55:57 -0400       8 months ago            David Morgan           origin/PROJ-13259
2021-10-19 16:19:54 +0000       7 months ago            David Graham           origin/PROJ-13214
2021-12-06 08:59:48 -0500       6 months ago            Art Donovan            origin/PROJ-14228
2022-01-05 18:22:36 +0000       5 months ago            David Graham           origin/PROJ-13228
2022-01-25 20:24:59 +0000       4 months ago            David Graham           origin/PROJ-14447
2022-04-05 18:18:48 +0000       6 weeks ago             Susan McDonald         origin/PROJ-15004
2022-04-06 14:18:16 +0000       6 weeks ago             Tracy Morgan           origin/PROJ-16375
2022-05-06 14:49:54 +0000       2 weeks ago             Dee Madison            origin/PROJ-16641
2022-05-06 14:49:54 +0000       2 weeks ago             Dee Madison            origin/PROJ-16666
2022-05-13 18:34:21 +0000       7 days ago              Alexis Veracruz        origin/PROJ-16507
2022-05-13 21:42:16 +0000       7 days ago              Gomez Addams           origin/PROJ-16653
2022-05-18 15:52:04 +0000       2 days ago              Ronald Johnson         origin/PROJ-16740
2022-05-19 17:18:44 +0000       19 hours ago            Thomas H Jones II      origin/master
2022-05-19 17:47:28 +0000       19 hours ago            Thomas H Jones II      origin/PROJ-16874
2022-05-19 20:57:26 +0000       16 hours ago            Kaiya Nubbins          origin/PROJ-16631
As you can see, there's clearly some cleanup to be done in this project.

Wednesday, April 20, 2022

Useful Term: Multi-Blocking

Around this time in 2012, a co-worker asked what I was working on, that day. Then, as now (and much of my career up to that point), I was assigned multiple customers with projects and tasks for each. I said to him, "I'm multi-blocking". It's a term I've used to describe my work-style for a long time …but wasn't until the co-worker looked blankly at me when I used the term. It was at that point that I realized I'd possibly coined a new term.

To explain, "multi-blocking" is in a similar vein to multi-tasking, but different. It's the (necessary) habit of running multiple, concurrent projects, but letting "blockers" determine which project goals you're actively working towards at any given time. Which is to say, you work on a project until some dependency stops you, then hop onto the next most pressing project that isn't also blocked. You do this kind of task-switching until either every project available to work is blocked or, processes you previously set into motion to unblock other, previously-blocked tasks finally result in one or more of those other tasks unblocking.

Other interruptions to multi-blocking can be "suddenly critical" things that aren't on your project plans being dumped into your lap. These either get added to the multi-blocking queue or supersede everything in it. The big down-side of this working-model is when you reach a state where you're 100% blocked. Then, it's total frustration time. If this happens frequently enough, or you're given a superseding task that also blocks, it can cause a total freak-out of frustration and denial of satisfaction.

Sadly, I find that this is still my primary workstyle. Interestingly, it stands in stark contrast to how a low of my co-workers seem to work. For them, if something blocks, they frequently just sit around until someone higher up from them asks, "what are you working on," at which point they finally reveal, "I'm blocked because of…"  at which point the higher-up person finally knows, "oh… apparently I need to help you to get unblocked if I want you to be productive".

Monday, April 4, 2022

Do I Need to Restart This Process

Co-worker on another project wanted to know "how do I write a script to restart a process only if it was last started before the system was most-recently patched. So, I Slacked him a quick "one-liner" of:

if [[ $(
         date -d "$(
            ps -p $(
               pgrep <SERVICE_PROCESS_NAME>
            ) -o lstart=
         )" "+%s"
      )
      -lt
      $(
         rpm -qa --qf '%{installtime}\n' | sort -n | tail -1
      ) ]]
then
   <CODE_TO_EXECUTE>
   …
else
   echo "Nothing to do (service restarted since last RPM was installed)"
fi

The above is a simple equality test where two (epoch) times are being compared. Epoch-time is used for comparison as it is the easiest format from which to determine, "is Time-1 more or less recent than Time-2".

Left-hand comparator:

The left expression uses a nested subshell to convert the target-processes start time from its normal format to epoch time. From the inside of the nest outward:

    1. Use `pgrep` to get the process-ID (PID) of the target service. The <SERVICE_PROCESS_NAME> value needs to be a string that appears only once in the process table
    2. Use the `ps` utility's `-p` flag to constrain output to that of the PID returned from the `pgrep` subshell and display only the targeted-process's  `lstart` attribute. The `lstart` attribute is one of several start-related attributes for a process (see man page for details).  Use of `lstart` attribute is because it provides a full time-specification. The other start-related attributes provide shorter, less-complete time-specifications that are not suitable for conversion to epoch time.
    3. Use the `date` utility's `-d` flag to specify the format of the time-string returned by the `ps` subshell – converting that subshell's time-string to epoch-format with the `%s` format-specifier.

Right-hand comparator:

The right expression is getting the install time of the most recently installed RPM. When using the `rpm` utility's query-format (`--qf`) to dump out an RPM's `installtime` attribute, the attribute-string is already in epoch-format and requires no further output-massaging. When using the `rpm` utility's "query all" capability, output is not time-sorted. Since the `installtime` attribute is just a numerical string, the output can be effectively time-sorted by using `sort -n`. Since we're only interested in the youngest RPM, using `tail -1` gets us the final element of the number-sorted output.

I did note to my co-worker that, if they're following a "patch and reboot" standard that his service-process should never be older than the most-recently installed RPM. So, not sure what the ultimate aim of the test will be.